
From your blood, your urine, and you. Every one is read in your report; if we can't read it into a decision, we don't count it.

Every report includes your biological age, calculated with PhenoAge, a peer-reviewed formula developed at Yale, from nine markers on this panel. One number that tracks the net effect of everything you do.





Every data point, explained.
How your body produces and uses energy. The foundation of how you feel day to day. Problems here develop silently for years before showing up as diabetes or metabolic disease.
Blood sugar & insulin
Measured
Fasting glucose
Your blood sugar after an overnight fast. The starting point for understanding metabolic health.
HbA1c
Your 3-month average blood sugar. More reliable than a single glucose reading.
Fasting insulin
How hard your pancreas is working to keep blood sugar in check. Elevated insulin is one of the earliest signals of metabolic dysfunction — often years before glucose rises.
Calculated
HOMA-IR
A calculated measure of insulin resistance. The lower the number, the more efficiently your body handles sugar.
TyG index
A second, independent check on insulin resistance using triglycerides. Confirms or challenges the HOMA-IR reading.
eAG
Your HbA1c converted into a daily average blood sugar number. Makes the data immediately relatable.
Glucose/Insulin ratio
How much insulin your body needs to hold your fasting glucose. A low ratio is an early sign of insulin resistance.
TyG-BMI
The TyG index scaled by your BMI. A validated marker of insulin resistance that adds body size to the blood picture.
Thyroid
TSH
The signal from your brain telling your thyroid how hard to work. The standard screening test, but not the full story.
Free T3
The active thyroid hormone. The one that actually drives your metabolism and energy levels.
Free T4
The main hormone your thyroid produces. Your body converts it into the active form, T3.
Body composition
Calculated
BMI
Weight relative to height. A rough screen for weight-related risk, interpreted with your waist and your blood, not alone.
Waist-to-height ratio
The simplest rule of thumb for metabolic risk: keep your waist below half your height.
From your questionnaire
Height
Needed for BMI and the waist-to-height ratio. Reported by you at intake.
Weight
Reported by you at intake. Read together with your metabolic markers, never on its own.
Waist
Where the weight sits matters more than how much. Measured by you at the navel, at intake.
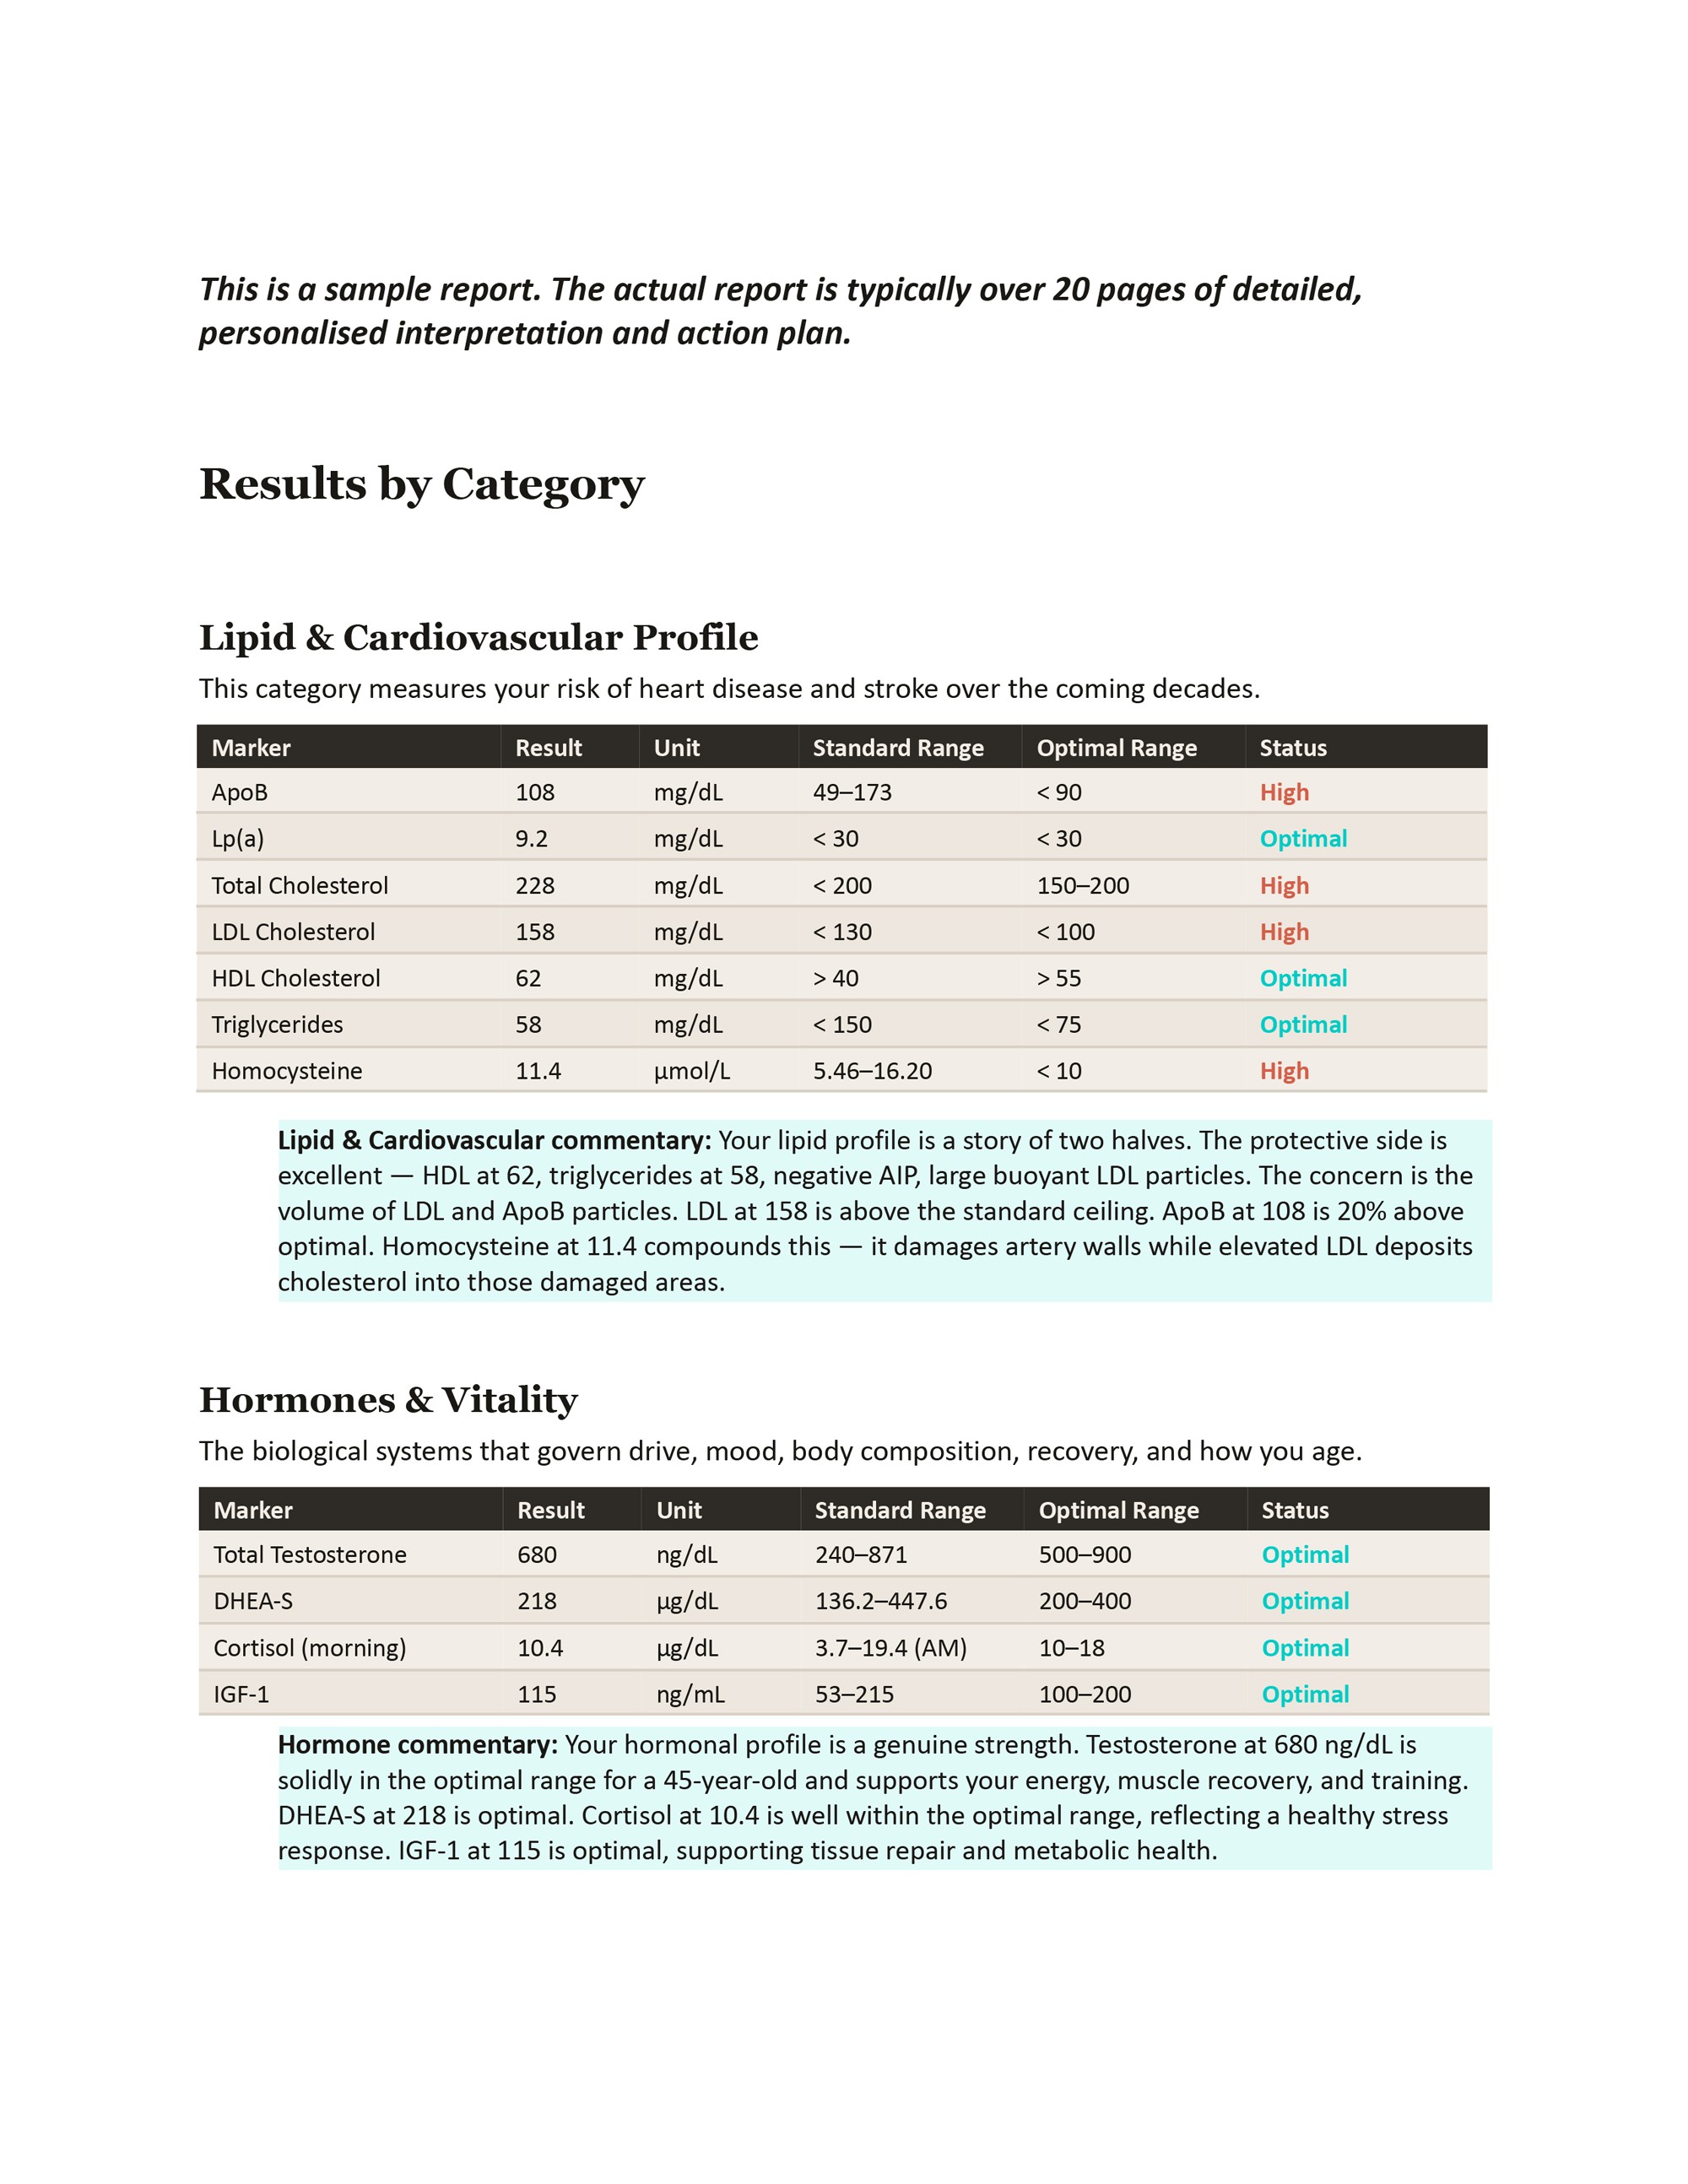
Your risk of heart disease and stroke over the coming decades. We go well beyond standard cholesterol to measure the data point that actually predict risk.
Primary markers
Measured
ApoB
The single most accurate measure of how many harmful particles are circulating in your blood. More predictive than LDL alone.
Lp(a)
A genetically determined risk factor for heart disease. You can't change it, but you need to know if you carry it.
Total cholesterol
The headline number. Useful as context, but the markers below tell the real story.
LDL cholesterol
The particles that deposit cholesterol in artery walls. The one most people know, but not the full picture.
HDL cholesterol
The protective cholesterol. Higher is generally better. Works alongside triglycerides to assess overall lipid health.
Triglycerides
Blood fats tied to diet, metabolism, and cardiovascular risk. Excellent when low, a warning sign when elevated.
Homocysteine
An amino acid that, when elevated, directly damages artery walls. Linked to B12 and folate status.
Calculated
VLDL
A triglyceride-carrying particle produced by the liver. Low is good.
Rations & risk scores
TC/HDL ratio
Total cholesterol relative to protective HDL. A quick gauge of overall lipid balance.
TG/HDL ratio
Triglycerides relative to HDL. One of the best simple predictors of insulin resistance and particle size.
LDL/HDL ratio
Harmful particles relative to protective ones. Lower is better.
AIP
A composite index of cardiovascular risk. Negative values are favorable.
Non-HDL cholesterol
All the cholesterol carried by particles that can build plaque. Tracks ApoB closely and is easy to follow over time.
Non-HDL/HDL ratio
Plaque-forming cholesterol against protective cholesterol in one number. Lower is better.
VAI (Visceral Adiposity Index)
Estimates fat stored around your organs from waist, BMI, triglycerides and HDL. Calculated only when you provide your waist.
The biological systems that govern drive, mood, body composition, recovery, and how you age. Subtle shifts here affect everything.
Hormones
Total testosterone
The headline hormone for energy, drive, muscle maintenance, and vitality. Declines naturally with age, but the rate matters.
DHEA-S
A precursor hormone tied to resilience, stress adaptation, and aging. One of the best markers of adrenal health.
IGF-1
A growth factor linked to tissue repair, muscle maintenance, and cellular health. Reflects growth hormone activity.
Cortisol (morning)
Your primary stress hormone. Morning levels reveal whether your stress response is calibrated or running too hot.
Vital nutrients
Vitamin D (25-OH)
Impacts immunity, mood, bone density, and hormone production. Deficiency is common in Thailand despite the sun.
Vitamin B12
Essential for nerve function, red blood cell production, and clearing homocysteine from your blood. Often low in people who feel fine.
Folate (serum)
A B vitamin critical for DNA repair, red blood cell production, and homocysteine metabolism.
Magnesium (serum)
Involved in over 300 biochemical reactions. Most people are deficient and do not know it.
White cells & inflammation
Measured
hs-CRP
High-sensitivity inflammation marker. Detects low-grade inflammation invisible to standard tests. A root cause of most chronic disease.
WBC
Your immune system's overall activity level. Too low or too high both warrant attention.
Neutrophils
Your body's first responders to infection and injury.
Lymphocytes
The adaptive immune cells that build targeted defenses. Key to long-term immunity.
Monocytes
Immune cells involved in tissue repair and chronic inflammation.
Eosinophils
Active in allergic responses and parasitic defense.
Basophils
The rarest white blood cells. Involved in allergic and inflammatory reactions.
Calculated
NLR
A calculated ratio reflecting the balance between your innate and adaptive immune systems.
PLR
Platelets against lymphocytes. A marker of low-grade inflammation, read alongside NLR and hs-CRP.
LMR
Lymphocytes against monocytes. Lower values point to chronic immune activation; used as context, not classified.
SII
Systemic immune-inflammation index, built from platelets, neutrophils and lymphocytes. A broader inflammation signal than any one count.
Red cells & iron
RBC
The cells that carry oxygen to every tissue in your body. Count, size, and content all matter.
Hemoglobin
The protein inside red blood cells that binds oxygen. The most direct measure of oxygen-carrying capacity.
Hematocrit
The proportion of your blood made up of red blood cells. Reflects hydration and oxygen delivery.
MCV
Average red blood cell size. Abnormal size points to specific nutritional deficiencies.
MCH
Average hemoglobin content per red blood cell. Works alongside MCV to identify the cause of anemia.
MCHC
Hemoglobin concentration within red blood cells. A more refined view of oxygen-carrying efficiency.
RDW
How consistent your red blood cell sizes are. High variation can signal nutritional deficiency or chronic disease.
Ferritin
Your iron storage level. Low ferritin causes fatigue and brain fog long before anemia shows up on a standard test.
Platelets
Platelets
The cells responsible for blood clotting. Both too few and too many are clinically significant.
MPV
Average platelet size. Larger platelets are more active and can signal increased clotting tendency.
Liver
Measured
ALT
A liver enzyme that rises when liver cells are stressed or damaged. The most sensitive routine liver marker.
AST
A liver enzyme also found in muscle. Context from other markers determines whether an elevation is liver-related or exercise-related.
ALP
A liver and bone enzyme. Helps distinguish between different types of liver stress.
GGT
A liver enzyme particularly sensitive to alcohol use and fatty liver. Helps distinguish whether elevated ALP is coming from the liver or from bone.
Total bilirubin
A byproduct of red blood cell breakdown processed by your liver. Mildly elevated levels can actually be protective.
Direct bilirubin
The water-soluble form processed by your liver for excretion. Helps pinpoint the source of bilirubin elevation.
Albumin
The most abundant protein in your blood. A marker of liver function, nutrition, and overall health status.
Total protein
Combined albumin and globulin. A broad indicator of nutritional and immune status.
Calculated
Indirect bilirubin
Total minus direct bilirubin. Rises with red-cell breakdown or Gilbert's syndrome, a common and harmless trait.
Globulin
Proteins produced by your immune system and liver. Reflects immune activity and inflammation.
A/G ratio
Albumin against globulin. A low ratio hints at inflammation, immune activity or liver stress; a high one is usually harmless.
De Ritis ratio (AST/ALT)
Distinguishes liver stress from muscle turnover. Especially useful if you exercise regularly.
FIB-4
Estimates liver scarring from age, AST, ALT and platelets. A low score makes advanced fibrosis very unlikely.
Kidney function
Measured
Creatinine
A waste product filtered by your kidneys. Stable levels mean your kidneys are working efficiently.
BUN
Blood urea nitrogen. Reflects protein metabolism and kidney function together.
Uric acid
Linked to gout, kidney stones, and cardiovascular risk when elevated. Easy to manage once identified.
Calculated
eGFR
Estimated kidney filtration rate. The single best number for overall kidney health.
BUN/Creatinine ratio
Separates dehydration and high protein intake from true kidney strain. A high ratio usually points to fluids.
Uric acid/Creatinine ratio
Uric acid adjusted for kidney function. Helps tell overproduction from reduced clearance.
Albumin/Creatinine (serum)
Context for how protein status and kidney filtration move together. Not the urine albumin test used to screen kidney damage.
Electrolytes
Measured
Sodium
The main salt your body uses to balance fluids. Your kidneys hold it in a tight band.
Potassium
Keeps your heart rhythm and muscles working. Too low and too high both matter.
Chloride
Works with sodium to keep fluid and acid balance steady.
TCO2
Your blood's acid-base balance, managed by lungs and kidneys together.
Calculated
Anion gap
A cross-check on acid-base balance that can flag problems the individual electrolytes miss.
Urinalysis
Color
Mostly hydration. Very dark or unusual colors can point to dehydration, blood or liver pigments.
Transparency
Clear is normal. Cloudy urine can mean infection, crystals or cells, and is read with the lines below.
Specific Gravity
How concentrated your urine is. Shows whether your kidneys concentrate and dilute properly, and how hydrated you were.
pH
Acidity of your urine. Shifts with diet and can affect the risk of certain kidney stones.
Protein (urine)
Should be negative. Protein leaking into urine is one of the earliest signs of kidney stress.
Glucose (urine)
Should be negative. Sugar in urine means blood glucose has exceeded what the kidneys can hold back.
Ketone
Expected on a ketogenic diet or after fasting. Otherwise a sign the body is burning fat for fuel under stress.
Erythrocyte
Blood in urine. Should be negative; a positive result needs a physician to find the source.
Leucocyte
White cells in urine. A marker of urinary tract infection or inflammation, read with nitrite.
Nitrite
Produced by many bacteria. A positive result strongly suggests a urinary tract infection, which is quickly treatable.
Urobilinogen
A bilirubin breakdown product. Small amounts are normal; high or absent levels are read with your liver markers.
Bilirubin (urine)
Should be negative. Its presence can point to liver or bile-duct problems before jaundice appears.
RBC (urine sedimentation)
Red cells counted under the microscope. Confirms and quantifies the erythrocyte strip result.
WBC (urine sedimentation)
White cells counted under the microscope. Confirms and quantifies the leucocyte strip result.
Squamous Epithelial Cell
Skin-type cells from the urinary tract. Mostly a sample-quality check; high counts suggest contamination.
For women who want full visibility into hormonal health, especially during perimenopause and menopause. Available as an add-on to the core program.
5,000 THB
Hormones
Luteinizing hormone (LH)
Works alongside FSH to regulate the menstrual cycle. The LH-to-FSH ratio is one of the key signals of where you are in the hormonal transition.
Follicle stimulating hormone (FSH)
Rising FSH is one of the earliest signals of perimenopause, often detectable years before symptoms appear.
Estradiol (E2)
The primary estrogen. Tracks hormonal shifts through perimenopause and menopause.
Progesterone
Balances estrogen and supports sleep, mood, and cycle regularity. Often the first hormone to decline.
Sex hormone binding globulin (SHBG)
Controls how much of your hormones are active vs bound. Affects the real impact of your estradiol and testosterone levels.
Free testosterone
The unbound, active fraction of testosterone. Important for energy, libido, mood, and body composition in women. Often overlooked in standard panels.